Here are some opportunities to raise your grade:
1. Click on the link below, take the practice exam, submit (email) your responses to mrconsidinescience@gmail.com for a BONUS Homework grade!
http://glencoe.mcgraw-hill.com/sites/0078771285/student_view0/unit2/chapter7/intermediate-level_science_exam_practice.html
2. There are online quizzes for Chapter 7 Sections 1, 2, and 3. Take each one and copy/paste it to an email and send it to mrconsidinescience@gmail.com for THREE BONUS Participation grades!
Section 1: http://glencoe.mcgraw-hill.com/sites/0078771285/student_view0/unit2/chapter7/section1/section_quizzes_-_english.html
Section 2: http://glencoe.mcgraw-hill.com/sites/0078771285/student_view0/unit2/chapter7/section2/section_quizzes_-_english.html
Section 3: http://glencoe.mcgraw-hill.com/sites/0078771285/student_view0/unit2/chapter7/section3/section_quizzes_-_english.html
3. Complete the crossword puzzle online, then copy it into your Science Notebook for a BONUS bump on your next quiz/test!
http://glencoe.mcgraw-hill.com/sites/0078771285/student_view0/unit2/chapter7/interactive_tutor.html#
Sunday, March 25, 2012

Tuesday, March 13, 2012

1) What does this weather map tell you about our conditions here in NYC? Can you predict tomorrow's weather?
Explain the following: 1) "H" and "L", 2) patches of green/pink/white, 3) blue lines with triangles, red lines with semi-circles. Which direction is the weather in the U.S., generally, moving?
2) Weather Journal - What is the weather today? Find the high and low temperatures (‘F/’C), the humidity (%), the air pressure (barometer), precipitation, and cloud cover. Make a journal of the weather each day this week. Be creative, make an illustration of what the weather means to you today.
For weather information on the web, check out the following websites:
www.weather.com ("search" 11220 for local weather)
www.weatherbug.com ("search" 11220 for local weather)
www.nytimes.com (look for NY weather in the top right corner)
- Considine
How to Read a Surface Map
Surface maps depict the large-scale elements of the weather. These elements include high and low pressure systems, cold and warm fronts, and precipitation areas. A high pressure system is an area of relative pressure maximum that has diverging winds and a rotation opposite to the earth's rotation. Fair weather is typically associated with high pressure.
A low pressure system is an area of relative pressure minimum that has converging winds and rotates in the same direction as the earth. This is counterclockwise in the Northern Hemisphere and clockwise in the Southern Hemisphere. Stormy weather is often associated with low pressure systems.
A cold front is the leading edge of an advancing cold air mass that is under running and displacing the warmer air in its path. Generally, with the passage of a cold front, the temperature and humidity decrease, the pressure rises, and the wind shifts (usually from the southwest to the northwest in the Northern Hemisphere). Precipitation is generally at and/or behind the front, and with a fast-moving system, a squall line may develop ahead of the front.
A warm front is the leading edge of an advancing warm air mass that is replacing a retreating relatively colder air mass. Generally, with the passage of a warm front, the temperature and humidity increase, the pressure rises, and although the wind shifts (usually from the southwest to the northwest in the Northern Hemisphere), it is not as pronounced as with a cold frontal passage. Precipitation, in the form of rain, snow, or drizzle, is generally found ahead of the surface front, as well as convective showers and thunderstorms. Fog is common in the cold air ahead of the front. Although clearing usually occurs after passage, some conditions may produce fog in the warm air.
Wednesday, February 1, 2012
Lab #13 – Heating Up and Cooling Down
LAB #9 – Heating Earth’s Surface
Hypothesis
Materials – 2
thermometers, 2 beakers, soil, water, lamp with 150 Watt bulb, stopwatch
Procedure –
1.
Fill one beaker
with water and one with soil.
2.
Put a thermometer
in each of the beakers.
Results
Temperature With Light On ('C)
|
Temperature With Light Off (‘C)
|
||||
Time (min.)
|
Soil
|
Water
|
Time (min.)
|
Soil
|
Water
|
0
|
0
|
||||
1
|
1
|
||||
2
|
2
|
||||
3
|
3
|
||||
4
|
4
|
||||
5
|
5
|
||||
6
|
6
|
||||
7
|
7
|
||||
8
|
8
|
||||
9
|
9
|
||||
10
|
10
|
Analysis
1.
(Draw two graphs;
graph 1 compares data from Temperature with Light On and graph 2 compares data
from Temperature With Light Off.)
2.
Calculate the
total change in temperature (‘C) for each material. Compare/Contrast the changes in temperature
for soil vs. water.
3.
What does the “soil”
represent on Earth? What does the
“water” represent on Earth?
4.
How does what you
have learned in this lab relate to weather and the formation of wind? (Hint: think High and Low pressure)
Conclusion
(Write a summary of your experiment (One full page!).
Was your hypothesis right? What did you learn?
What could you do next time? Was it fun? How is this
related to what we are learning in class?)
(Write a summary of your experiment (One full page!).
Was your hypothesis right? What did you learn?
What could you do next time? Was it fun? How is this
related to what we are learning in class?)
Lab #13 – Heating Up and Cooling Down
Do you remember how long it took for
a cup of hot chocolate to cool before you could take a sip? The hotter the
chocolate, the longer it seemed to take to cool.
Problem
How
does the temperature of a liquid affect how quickly it warms or cools?
Hypothesis
Materials
3 beakers
3 thermometers
Stopwatch
Ice
Hot plate
Procedure
- Use the data table to record the temperature of water in three beakers
every minute from 0 to 15 min.
- Fill one beaker with 100 mL of water. Place the beaker on a hot
plate and bring the water to a boil. Carefully remove the hot beaker from
the hot plate.
- Record the water temperature in your data table at minute 0, and
then every minute for 10 min.
- Repeat step 3 starting with water at room temperature and ice
water.
Results
Ice Water
Time (min.)
|
Temperature ('F)
|
Temperature ('C)
|
0
|
||
1
|
||
2
|
||
3
|
||
4
|
||
5
|
||
6
|
||
7
|
||
8
|
||
9
|
||
10
|
Room Temperature water
Time (min.)
|
Temperature ('F)
|
Temperature ('C)
|
0
|
||
1
|
||
2
|
||
3
|
||
4
|
||
5
|
||
6
|
||
7
|
||
8
|
||
9
|
||
10
|
Boiling Water
Time (min.)
|
Temperature ('F)
|
Temperature ('C)
|
0
|
||
1
|
||
2
|
||
3
|
||
4
|
||
5
|
||
6
|
||
7
|
||
8
|
||
9
|
||
10
|
Analysis
1.
Graph your data for all four
beakers; use only your temperatures in Fahrenheit! Use a different color for each beaker.
2.
Calculate the rate of heating or
cooling for the water in each beaker by subtracting the initial temperature of
the water from the final temperature and then dividing by 10 min.
3.
a. What is the independent
variable?
b. What is the dependent
variable?
c. What are your constants?
.a What happened to the temperature of
the boiling water?
b. What happened to the
temperature of the ice water?
c. Do you
think there will be a temperature at which they would eventually meet? If so, where do you think it will be? If not, why not?
Conclusion
Monday, January 30, 2012
Science Fair Projects
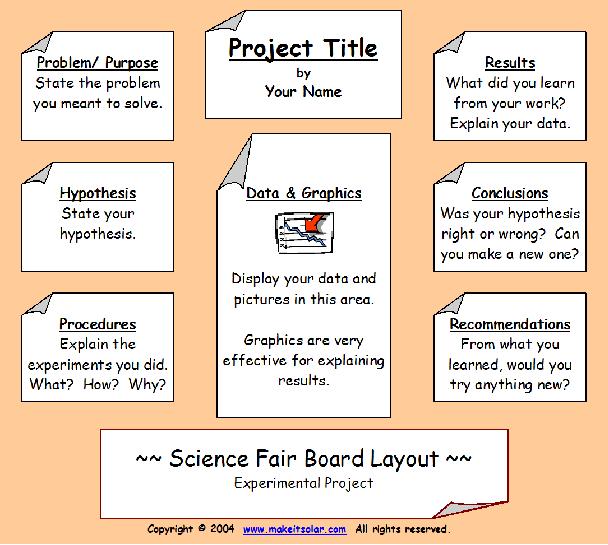


What does your report need?
• Name and Class
• Project Title
• Body Paragraphs
1)
Introduction
In this section,
explain your problem or question. Why
did you choose this problem? Where did
you get the idea? Give any relevant
background information here as well. (Why
did you do this project?)
2)
Hypothesis
In this section,
state your hypothesis. Why did you make
this hypothesis? What observations did
you make that led you to this hypothesis? (Remember: Your hypothesis is “a best
guess based upon your observations.”)
3)
Materials and Methods
In this section,
please give a list of your materials. You may simply
list your materials in a “bulleted list.”
4)
Results
In this section,
explain what happened in your experiment. Use charts, graphs, data tables, etc.
5)
Conclusion
What did you
learn? Was your hypothesis right or
wrong? What could
you do next with this experiment? Is there another experiment
that could follow this one?”
Subscribe to:
Posts (Atom)