Copy the NORTHERN Food Chain and the FOREST Food Chain into your notebooks and answer the following questions: a. What happens if you take the frog out of the FOREST Food Chain?
b. What happens if you take the fish out of the NORTHERN Food Chain?
Sometimes, a plunge in a pool or lake on a hot summer day feels cool and refreshing. Why does the beach sand get so hot when the water remains cool? A few hours later, the water feels warmer than the land does.
Problem
What is the effect of radiant energy from a light bulb on the temperature of a tray filled with "soil/land" and a tray filled with "water/sea"? ↑
Copy the problem, make a hypothesis, use the writing prompts to guide you.
↓
Hypothesis
If we add radiant energy from a light bulb to trays filled with "land" and "sea"....
then the temperatures of the trays will ______________________, and this is because _______________________________________. (What will happen to the temperature of the soil and water when the light is turned on? What will happen to the soil and water after the light has been turned off? Will they cool down evenly? Will they heat up the exact same? Will they heat up differently? Will there be a change in temperature? Why do I think this?)
Materialscopy the materials
Soil Water Containers for soil and water Overhead light Thermometers
Stopwatch
Procedure
DO NOT COPY.. You don't DO this, I did it, watch the videos.
1.Add 300 ml of water to one of the boxes and 300 ml of soil to the other box.
2.Use a thermometer to find the temperature of the water and soil in each container. Record your data in the Results section.
3.Place the containers side by side underneath the overhead light. Be sure both containers receive the same amount of light.
4.Measure the temperature of the water in each container at 1-minute intervals for 10 minutes. Record your data in the Results.
5.After you record your 10 minute reading, turn off the light and take your initial reading with the light off.
6.Measure the temperature of the water and soil in each container at 1-minute intervals for 10 minutes. Record your data in the Results.
Resultswatch the videos, copy the data into these tables
Temperature With Light On (°F)
Temperature With Light On (°F)
Temperature With Light Off (°F)
Temperature With Light Off (°F)
Time (min)
Soil
Water
Time (min)
Soil
Water
0
0
1
1
2
2
3
3
4
4
5
5
6
6
7
7
8
8
9
9
10
10
AnalysisAnswer these completely, make line graphs
1.Graph the data from the table using a line graph in degrees Celsius. Use one colored pencil to show data for the water container and a different one to show data for the soil container with the light on. Make a second graph with the light off. X-Axis: Time (min.), and Y-Axis: Temperature (°C). Draw lines to connect the temperature for each container.
2.Calculate the total change in temperature for each material. Do this by using the following formula:
Total Change = Final Temperature - Initial Temperature
3.Which material had the greater increase in temperature? Why do you think this is?
4.Inferfrom your graphs which cooled faster—the water or the soil. How could you prove this?
5. What was your independent variable? What was your dependent variable? What are three variables that should remain constant?
6. Relate: What is this modeling in the real world? (Hint: watch above videos)
7a. Draw a picture of the lab setup with the light on. Label the following: lithosphere (land), hydrosphere (water), sun (light), convection arrow/heating up, convection arrow/cooling down, sea breeze. 7b. Draw a picture of the lab setup with the light off. Label the following: lithosphere (land), hydrosphere (water), convection arrow/heating up, convection arrow/cooling down, land breeze.
1.If the surrounding air is pressing down on the kids with ~15 lbs on every inch of their bodies, why aren’t they being crushed?
2.How is air pressure different at sea level than higher up in the atmosphere? Draw a picture.
3.What is going on with the changes in volume with that balloon?
4.An egg is used as a model for the thickness of the atmosphere, what makes this a good model?
***From 2:00 til the end, there are instructions on how to make a barometer. Make one of these at home, measure the changes in air pressure, record your results. TWO WEEK HOMEWORK PASS AWARDED***
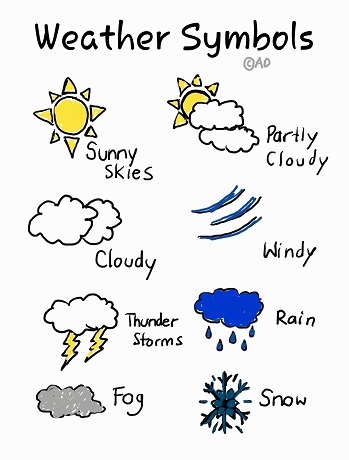
Daily Weather Journal - What is the weather today?
Make a journal of the weather explore how the weather affects your life! Illustrate your experience
with the weather today. Use weather symbols, pictures, images; be
creative! Each journal entry should take up a full
page; 1/2 page for Written information and 1/2 page for Illustration.
All weather is LOCAL. Wherever you complete your weather journal and whichever time, use that TIME and LOCATION.
Written information
A. Weather Data 1. Temperature °F & °C 2. Humidity (%) 3. Precipitation (in/mm) 4. Cloud cover
5. Wind speed (mi/h or km/h)
B. Personal Paragraph - How does this weather affect you? How does it affect your clothing, outdoor
activities, etc?
How does the weather affect what you eat or drink, what you do, where you go, what you can or cannot do? ***5 Sentence Summary***
Self Expression C. Illustration - Be creative, make an illustration of what the weather means to you today and how it affects your daily life. Illustrate your experience with the weather today. Use weather symbols, pictures, images, be creative! This should be ½ page. Click on the link below to read MY weather journal! Mr.Considine's Weather Journal Click on the link above to read MY weather journal!