Labels

Sunday, February 13, 2022

Black History Month Celebrates the Contributions of Black People in the Scientific Community!


Follow these simple steps to make an A!

1) Summarize the article in 5-7 sentences (i.e. What is the article about?)
2) How does this affect us? (1 sentence min.)
3) Why is this important? (1 sentence min.)
4) How is this science related? (1 sentence min.)
5) Pick a science word and write its definition.  Use a dictionary or www.dictionary.com 
6) Draw a picture!
7) Make sure to include your source.  i.e. Where did you get your information from?  website url, magazine title and date, newspaper title and date


Choose ONE of the articles to read below, read it, then follow the rubric for composing a science article: 

1. ‘I Trust Science,’ Says Nurse Who Is First to Get Vaccine in U.S.

2. Victor Glover becomes first Black astronaut to arrive at space station for long-term stay

3. The Science Of Scary: Why It's So Fun To Be Freaked Out

4. This NASA Engineer Is Bringing Math And Science To Hip Hop

5. America has vaccines thanks in part to an African slave who saved Boston from smallpox

6. The Secret Life of Scientists & Engineers | Neil deGrasse Tyson

7. The Secret Life of Scientists & Engineers | Jim Gates

8. The Secret Life of Scientists & Engineers | Bruce Jackson

9. The Secret Life of Scientists & Engineers | Mae Jemison

10. Stephon Alexander THE SECRET LIFE OF SCIENTISTS AND ENGINEERS

11. The Secret Life of Scientists & Engineers | André Fenton

Sunday, February 6, 2022

Lab #8 – Tracking Hurricanes


Lab #8 – Tracking Hurricanes

Hurricanes are classified according to the Saffir-Simpson Scale, which categorizes the storms from one to five depending on sustained wind speed, height of storm surge, and extent of damage. Some of the specifics for each hurricane category are listed in Table 1. The National Weather Service issues a hurricane watch when there is a threat of hurricane conditions within 24 to 36 hours. They issue a hurricane warning if hurricane conditions are expected within 24 hours.

Problem

How are hurricanes tracked?

Hypothesis


Materials

Pencil
Atlantic Basin Hurricane Tracking Chart found at http://www.nhc.noaa.gov/AT_Track_chart.pdf

Procedure

Part a—Historical Hurricanes

  1. Familiarize yourself with the classifications of hurricanes according to the Saffir-Simpson Scale in Table 1.
  2. Read about some major hurricanes of the past, which are described in the Data and Observations section, and watch the 2012 Hurricane Sandy Video.
  3. Use the Saffir-Simpson Scale to classify each of the historical hurricanes described in the Data and Observations section. Write the category number in the space provided next to each description.

Part B—Hurricane Tracking

  1. Use the data in Table 2 to plot the course of a hurricane. Start by plotting the storm's location on Day 1 on the Hurricane Tracking Chart in Figure 1.Mark the hurricane's location with a dot, and label it as Day 1.
  2. Considering only wind speed, classify the storm as a tropical storm or a hurricane. If the wind speed is less than 119 km/h, consider it a tropical storm. If the wind speed is 119 km/h or more, use the Saffir-Simpson Scale to decide what category describes the hurricane on this day. Write your observations in Table 2.
  3. Plot the storm's location at Day 2, label the dot, and connect the two dots with a straight line. Classify the storm as described in step 2.
  4. Consider that you are a forecaster with the National Weather Service. You must issue a hurricane warning to any land 24 hours before the center of a hurricane passes over it. Decide if you should issue a warning on Day 2. If yes, what areas would you warn? Write your observations in Table 2.
  5. Repeat steps 3 and 4 for the storm's duration.

Part A

Data and Observations

In the space provided, list the category of each storm; use the Saffir-Simpson Scale below.
  1. ____ Hurricane Fran moved into North Carolina's southern coast in September 1996. Total damages from the hurricane exceeded $5 billion. Hurricane Fran had sustained winds of approximately 184 km/h and gusts as high as 200 km/h.
  1. ____ The Halloween Storm of 1991 has been called the "perfect storm." It packed sustained winds of 120 km/h.
  1. ____ Hurricane Bertha pounded the southeast coastline as well as the Bahamas in July 1996. The storm had winds peaking at 184 km/h.
  1. ____ When Hurricane Andrew slammed southern Florida in August 1992, it was the most costly natural disaster in United States history, with about $26 billion in damage. The storm killed 26 people and destroyed more than 25,000 homes. Its wind speeds are now thought to have reached up to 265 km/h.
 5. ____ Hurricane Celia hit Texas in August 1970, causing $1.6 billion in damage. The storm was characterized by very high winds that damaged an airport and destroyed a nearby mobile home park. Its highest estimated wind speed was around 257 km/h.
  1. ____ Hurricane Camille, which hit the Gulf Coast and then swerved east toward the Carolinas in August 1969, was the fifth most costly disaster in United States history with damages of $5.2 billion. Camille caused the death of 250 people. Its sustained wind speeds reached 320 km/h.
  1. ____ Hurricane Katrina, which devastated New Orleans in 2005 was the costliest hurricane, as well as one of the five deadliest, in the history of the United States. Among recorded Atlantic hurricanes, it was the sixth strongest overall.  Katrina made landfall Aug. 29 with top sustained wind of about 201 km/h.
8.       ____ Hurricane Irene, made its final landfall in Brooklyn, New York City in 2011.  Throughout its path, Irene caused widespread destruction and at least 56 deaths. Damage estimates throughout the United States are estimated near $15.6 billion.  Its highest winds reached 120 mph (195 km/h).
       9. ____ Hurricane Sandy affected 24 states in the U.S., including the entire eastern seaboard from Florida to Maine and west across the Appalachian Mountains to Michigan and Wisconsin, with particularly severe damage in New Jersey and New York. Its storm surge hit New York City on October 29, 2012, flooding streets, tunnels and subway lines and cutting power in and around the city. Damage in the United States amounted to $65 billion.  Its highest winds reached 115 mph (185 km/h).


Table 1

Saffir-Simpson Hurricane Scale


Category
Wind Speed (km/h)
Effects
One
119-153
No real damage
Two
154-177
Some roof and window damage
Three
178-209
Some structural damage to small residences; mobile homes destroyed
Four
210-249
Extensive building failures
Five
greater than 249
Complete roof failure on buildings; some complete building failures

 Part B

Day
Latitude (°N)
Longitude (°W)
Wind speed (km/h)
Type of Storm
Issue warning? Where?
  1
15
47
  56


  2
17
53
  80


  3
18
57
112


  4
21
60
144


  5
23
64
160


  6
23
69
232


  7
25
74
216


  8
27
78
216


  9
32
79
168


10
41
74
  96


11
45
67
  72


12
48
56
  64


Analysis

  1. Which of the storms described in Part A were category five hurricanes?
  1. What information did you use to classify each of the storms?
  1. The formation of a hurricane depends on what three factors?
  1. When did the hurricane tracked in Part B reach the status of a category three hurricane? (Hint: The data presented in Table 3 shows one measurement for each day of the storm.
  1.   Reflect: A hurricane starts out as a low pressure system, why is this so?  Why would a high pressure area not turn into a hurricane?  (Hint: Think of the water cycle.)
  2. There is a hurricane warning; what are three things you do to prepare for it?
­____________________________________________________________________


Conclusion


 What was your problem?
 Restate your hypothesis.  Was it right? wrong?  why or why not?
 What did you learn in this lab?
 What did you like about this lab?
 What were some challenges you had to deal with?
 What could you do next with this problem?  What other tests could you perform?
 Write down any other additional thoughts, observations, inferences, etc.


Monday, January 24, 2022

Interpreting a weather map HW


 Can you predict tomorrow's weather?
Explain the following: 
1) "H" and "L",
 2) patches of green/pink/white, 
3) blue lines with triangles, red lines with semi-circles.  
4) Which direction is the weather in the U.S., generally, moving?
5)  What does this weather map tell you about our conditions here in NYC? 


Saturday, November 20, 2021

C.5 - Thermal Energy, Heat, and Temperature Online Exploration

Introduction: Heat always travels from a ______ object to a ________ object.
 1. Conduction
     a. Conduction is the transfer of ____ between substances that are in ______ with each other. 
     b. The better the ________, the more quickly ____ will transfer from the higher _________ to the _____ temperature. 
     c. Three examples of good conductors are: _____, _______, and ________.  
         What are these used for in the kitchen?
     d. A poor conductor is a good _________. 
         What are these used for in the kitchen? 


2. Convection
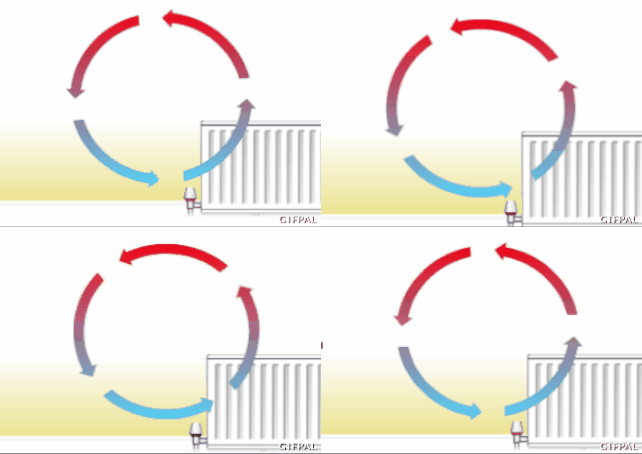
 a. Draw a picture of a convection current.  Label the red and blue arrows. 
 b. What is convection?
 c. What are some other examples of convection?
 d. Convection is the primary method that heat transfers in _______ and _____.
 e. Which is denser, cold air or warm air?  Explain.
f. 


Convection currents heat rooms.

rainbow lava lamp GIF
Convection currents make lava lamps hot and cool.


3. Radiation

a. When electromagnetic _____ travel through space, it is called ________. 
b. These waves transfer ____ to object. 
c. The ___ transfers heat to the _____ via ________ waves; this keeps us warm!
d. Draw a picture of the sun heating Mr. C up at the park or beach; don't forget the electromagnetic waves.
e. What are two other examples of radiation heat transfer?


4. IXL - I.1 

Predict heat flow and temperature changes


Sunday, October 31, 2021

Generating Electricity videos

A. Energy 101: Electricity Generation
 1. Some energy sources are finite or non-renewable like fossil fuels such as ____ and ___.
 2. Other energy sources are infinite or unlimited like _____ or _______.
 3. Today the majority of America's electricity comes from _______ power plants.
 4.  Fuels are used to heat _____ until it produces _____ which powers a _______ that _________ electricity.
 5. It's the ________ inside a turbine that turns _________ energy into __________ energy.
 6. (Pause the video at 2:20 min mark.) Sketch and label: fuel/fire, water, steam, turbine/generator.
 7. Make an inference; why is there a dinosaur in the cartoon?

B.  Electricity Song

Wednesday, October 27, 2021

Forms of Energy Slideshow


Forms of Energy Slideshow
You are going to show your knowledge of the various forms of energy: 1. thermal, 2. radiant, 3. electrical, 4. mechanical, 5. sound 🔊, and 6. chemical.  

Include the following information on each slide:
  1. The form of energy
  2. An image/gif showing the form of energy.
  3. A scientific definition put into your own words; match the sentence with the image/gif.
  4. Each picture should have a caption that includes  “this type of energy is transformed/changes into this type of energy
  5. BONUS Slide!! - Choose a Form of Energy and MEME it!!! Create YOUR OWN meme showing your understanding of that form of energy. Get creative!!!
**Example**
1. CHEMICAL ENERGY
2. 

3. Chemical energy is found in food; it gives us energy to eat, drink, and move around.
4. The chemical energy in the food transforms into mechanical energy and thermal energy in my body.


Sunday, October 24, 2021

Lab # 2 – Crazy Coasters and the Exploration of Potential vs. Kinetic Energy


Lab # 2 – Crazy Coasters and the Exploration of Potential vs. Kinetic Energy

Introduction
Who likes roller coasters?  I do! The purpose of the coaster's initial ascent is to build up its potential energy. The concept of potential energy, often referred to as energy of position, is very simple: As the coaster gets higher in the air, gravity can pull it down a greater distance. You experience this phenomenon all the time: think about riding your bike or pulling your sled to the top of a big hill. The potential energy you build going up the hill can be released as kinetic energy -- the energy of motion that takes you down the hill.
  
Problem
How does the starting height of a marble on a coaster track affect the speed it gathers to complete a successful loop?

Hypothesis

I hypothesize that if... _________________________________________________________________________________


then... __________________________________________________________________________________________________

because... __________________________________________


Materials
Foam pipe insulation
Glass marble
Ruler
Tape
Triple beam balance

Procedure
  1. Construct your crazy coaster track using the materials provided.
  2. Lay the track on the ground and make a loop with 1/3 of the length; the loop should be ~ 24-30 cm in diameter.  Tape the loop to the side of the track to keep its shape.
  3. Take turns trying to get the marble to complete the loop successfully; a marble that does not complete the loop or jumps the track is unsuccessful.  Record your data in the table below and make any additional observations on its energy. 
  4. Using a triple beam balance, weigh the mass of the marble and enter it below.
  5. Measure the length of track and record your data into your Results.
Variables:
Independent

Dependent

Constants

  
Additional Data

Loop diameter   = ___ cm 
Mass of marble = ___ grams


Results

Starting height (cm)
Successful loop completion by marble – 3 trials (Y/N)
Additional observations about the marble's "energy" – one prediction, one observation, one inference for each starting height.  
0.0 cm
1.
2.
3. 
Prediction:
Observation:
Inference: 
25.0 cm
1.
2.
3.
P:
O:
I: 
50.0 cm
1.
2.
3.
P:
O:
I: 
75.0 cm
1.
2.
3.
P:
O:
I: 

100.0 cm
1.
2.
3.
P:
O:
I: 
125.0 cm
1.
2.
3.
P:
O:
I: 
150.0 cm
1.
2.
3.
P:
O:
I: 
MAX ___ cm
1.
2.
3.
P:
O:
I: 


Variables:
Independent

Dependent

Constants (3)


Estimate the marble's Kinetic Energy by eyeballing its speed (3 is fastest and 1 is slowest)
Point A

Point B

         Point C


Analysis

1.        At what heights were you able to successfully complete the loop?

2.        Why didn’t the marble complete the loop at lower positions?  At higher positions?

3.        How does height affect potential energy?

4.        Where on the crazy coaster was the marble’s potential energy  at its lowest?  Its highest?  Draw a picture and label these positions.

5.       Starting height minimum for successful loop = ____ cm

6. Calculate the marble’s Potential Energy (P.E.), at each position, using the following equation: Potential Energy = (mass)(gravity)(height)
P.E. = mgh
 (note: gravity ~ 10 m/s2


     A.  Describe the energy the marble would have at a starting height of 0.0 m. 

        B.  Calculate the PE of your marble at a starting height                = 0.0 m. 


7. The Law of Conservation of Energy states that energy is never created or destroyed; it just changes form.  How do your results show this?

8. Bar graph showing how starting height affects the energy of a marble completing a loop.  
Graph your data.  
X- axis: Starting Height (cm) Potential Energy;
 Y- axis: Successful Loop - Yes, No,  Kinetic Energy 


Conclusion
What was your problem?
 Restate your hypothesis.  Was your hypothesis right or wrong?  What facts would support this?
 What did you learn in this lab?
 What did you like about this lab?
 What were some challenges you had to deal with?
 What could you do next with this problem?  What other tests could you perform?
 Write down any other additional thoughts, observations, inferences, etc.


543210
Table of ContentsPage numbers, title of lab, dates all presentOne is missingTwo are missingTwo missing & incompleteThree missingZERO
Title of LabWritten with full heading at beginning of labWritten in wrong locationPartially written-------ZERO
ProblemCopied from Science Scholars BlogPartially written----------ZERO
HypothesisWritten after Problem, If... Then... Because... statement presentIf... Then... Because... statement present, but wrong locationPartially written-------ZERO
MaterialsCopied from Science Scholars BlogPartially written----------ZERO
Data TablesRuler used, data entered, units shown, numbers rounded to nearest tenthOne aspect missingTwo aspects missingThree aspects missingIncompleteZERO
GraphTitle present, x and y axes labeled, units listed matches data from tablesOne aspect missingTwo aspects missingThree aspects missingIncompleteZERO
Analysis Q/AALL of the questions are answeredOne aspect missingTwo aspects missingThree aspects missingIncompleteZERO
ConclusionALL of the questions are answeredOne aspect missingTwo aspects missingThree aspects missingIncompleteZERO
Additional observations, sketches, inferencesEvidence shown-------------ZERO