Tuesday, September 20, 2016
Thursday, September 8, 2016
Scientific Summer Essay
Scientific Summer Essay
Write a five paragraph essay about your summer.
•The first paragraph is the introduction.
•Paragraphs 2, 3, and 4 are the body.
•Paragraph 5 is the conclusion.
•Write about how your summer was related to Science. What did you do over the summer that was related to Science? Use your What is Science? list to assist you.
This assignment will be your Portfolio #1 entry.
4
|
3
|
2
|
1
|
0
|
Total Points
|
|
Heading, Neatness, Overall Organization
|
The loose leaf is neat, the heading is legible, the work is
organized
|
There is some disorganization.
|
Parts of the heading are missing.
|
There is no heading. The
loose leaf is torn. It is
disorganized.
|
||
Introduction
|
There is an Introduction paragraph with at least five sentences.
|
There is an Introduction paragraph with only four sentences.
|
There is an Introduction paragraph with only three sentences.
|
There is an Introduction paragraph with only two sentences.
|
There is no Introduction.
|
|
Conclusion
|
There is a Conclusion paragraph with at least five sentences.
|
There is a Conclusion paragraph with only four sentences.
|
There is a Conclusion paragraph with only three sentences.
|
There is a Conclusion paragraph with only two sentences.
|
There is no Conclusion.
|
|
Body Paragraphs
|
There are three body paragraphs with five sentences each.
|
Incomplete
|
Incomplete
|
Incomplete
|
There are no body paragraphs.
|
|
Use of Science Words
|
There are at least ten Science words used.
|
There are 8-9 Science words used.
|
There are 6-7 Science words used.
|
There are 4-5 Science words used.
|
There are less than four Science words used.
|
Wednesday, August 3, 2016
Scientific
Summer Essay
Write a five
paragraph essay about your summer.
•The
first paragraph is the introduction.
•Paragraphs
2, 3, and 4 are the body.
•Paragraph
5 is the conclusion.
•Write
about how your summer was related to Science.
What did you do over the summer that was related to Science? Use your What is Science? list to assist you.
This assignment will be your Portfolio #2 entry.
Wednesday, May 11, 2016
Lab #9 – The Cell and its Organelles
Problem
How are plant cells and animal cells
both similar and different?
Hypothesis
Materials
I will supply: 2 zip-loc bags: inner bag = cell membrane
1 loose plastic bag: outer bag = cell wall
1 loose plastic bag: outer bag = cell wall
Oil (cytoplasm)
red beans, red and black beads (organelles)
green beads (chloroplasts)
clay or balloon (nucleus)
green beads (chloroplasts)
clay or balloon (nucleus)
water (vacuole)
Please bring: uncooked pasta, candy, uncooked rice, get creative!
Please bring: uncooked pasta, candy, uncooked rice, get creative!
Procedure
Step 1
Pour vegetable oil into one of your Ziploc bags until it’s about half full. The vegetable oil represents the cell’s cytoplasm.

Step 2
Add a piece of cauliflower to the bag. This will be your nucleus.

Step 3
Place three or four mandarin oranges as mitochondria and three or four green grapes as chloroplasts in the bag.

Step 4
Pour water into a balloon until it is two or three times the size of your nucleus bouncy ball. Tie the end of the balloon and place it in the Ziploc. This will serve as the vacuole, a fluid-filled space within the cell.

Step 5
Add several pieces of pipe cleaner as endoplasmic reticulum.

Step 6
Add a piece of ribbon candy to represent the Golgi apparatus and a small marble for the centrosome.

Step 7
Sprinkle in a small handful of sesame seeds. These will represent the cell’s ribosomes.

Step 8
Add more vegetable oil to the bag, if needed, until it is fairly full but still has plenty of give. Close the bag.

Step 9
Maneuver the organelles so they are spread throughout the bag. Make sure your centrisome and Golgi apparatus end up near the nucleus, as this is how they’re situated in a real cell.

Step 10
Place the bag inside your second Ziploc bag. If it doesn’t fit easily, pour out oil until it does.

Step 11
Drizzle a little bit of oil in the space between the two bags. This represents the cell membrane, a thin, semi-permeable membrane between the cell wall and the rest of the cell. Close up the second bag.
Don’t forget to label your Ziploc
bags (Cell Membrane) for BOTH plant and animal cells.
Results
Animal Cell
|
Plant Cell
|
Analysis
- Compare/Contrast your plant and animal cells.
- Predict what would happen to a plant cell if it were to lose its
chloroplasts.
- Explain the importance of the nucleus in both cells.
4.
On your gel cells,
what is representing the cell membrane? How is the cell membrane like
your skin?
_____________________________________________
5.
Create your own model of an animal
and/or a plant cell. What materials
would you use? Make a list of what is
going to represent the following: cytoplasm, cell membrane, nucleus,
organelles, cell wall, chloroplasts.
Conclusion
Wednesday, April 20, 2016
Lab #8 – Tracking Hurricanes
Lab #8 – Tracking Hurricanes
Hurricanes are classified according to the Saffir-Simpson
Scale, which categorizes the storms from one to five depending on sustained
wind speed, height of storm surge, and extent of damage. Some of the specifics
for each hurricane category are listed in Table 1. The National Weather Service
issues a hurricane watch when there is a threat of hurricane conditions within
24 to 36 hours. They issue a hurricane warning if hurricane conditions are
expected within 24 hours.
Problem
How are
hurricanes tracked?
Hypothesis
Materials
Pencil
Procedure
Part
a—Historical Hurricanes
- Familiarize
yourself with the classifications of hurricanes according to the
Saffir-Simpson Scale in Table 1.
- Read
about some major hurricanes of the past, which are described in the Data
and Observations section, and watch the 2012 Hurricane Sandy Video.
- Use
the Saffir-Simpson Scale to classify each of the historical hurricanes
described in the Data and Observations section. Write the category number
in the space provided next to each description.
Part
B—Hurricane Tracking
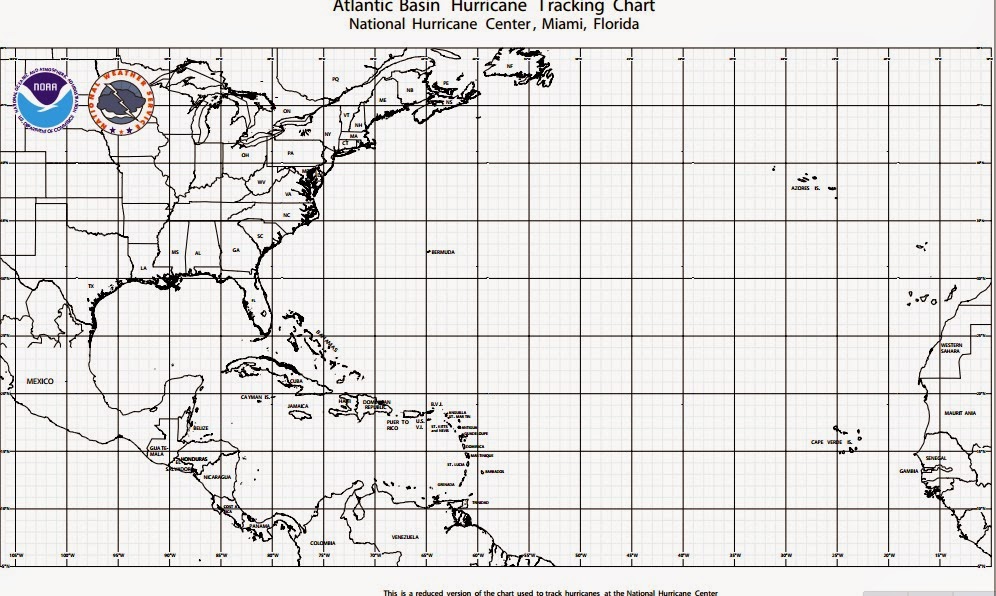
- Use
the data in Table 2 to plot the course of a hurricane. Start by plotting
the storm's location on Day 1 on the Hurricane Tracking Chart in Figure
1.Mark the hurricane's location with a dot, and label it as Day 1.
- Considering
only wind speed, classify the storm as a tropical storm or a hurricane. If
the wind speed is less than 119 km/h, consider it a tropical storm. If the
wind speed is 119 km/h or more, use the Saffir-Simpson Scale to decide
what category describes the hurricane on this day. Write your observations
in Table 2.
- Plot
the storm's location at Day 2, label the dot, and connect the two dots
with a straight line. Classify the storm as described in step 2.
- Consider
that you are a forecaster with the National Weather Service. You must
issue a hurricane warning to any land 24 hours before the center of a
hurricane passes over it. Decide if you should issue a warning on Day 2.
If yes, what areas would you warn? Write your observations in Table 2.
- Repeat
steps 3 and 4 for the storm's duration.
Part A
Data and Observations
8. ____ Hurricane
Irene, made its final landfall in Brooklyn,
New York City in 2011. Throughout its
path, Irene caused widespread destruction and at least 56 deaths. Damage estimates
throughout the United States are estimated near $15.6 billion. Its highest winds reached 120
mph (195 km/h).
9.
____ Hurricane Sandy
affected 24 states in
the U.S., including the entire eastern
seaboard from Florida to Maine and west across the Appalachian Mountains to Michigan and Wisconsin, with particularly severe damage in New Jersey and New York. Its storm surge hit New York City on October 29, 2012, flooding streets, tunnels and subway
lines and cutting power in and around the city. Damage in the United States
amounted to $65 billion. Its
highest winds reached 115 mph (185 km/h).
|
Table
1
Saffir-Simpson Hurricane Scale
|
||
Category
|
Wind Speed (km/h)
|
Effects
|
One
|
119-153
|
No real damage
|
Two
|
154-177
|
Some roof and window damage
|
Three
|
178-209
|
Some structural damage to small residences; mobile homes
destroyed
|
Four
|
210-249
|
Extensive building failures
|
Five
|
greater than 249
|
Complete roof failure on buildings; some complete building
failures
|
Part B
Day
|
Latitude (°N)
|
Longitude (°W)
|
Wind speed (km/h)
|
Type of Storm
|
Issue warning? Where?
|
1
|
15
|
47
|
56
|
||
2
|
17
|
53
|
80
|
||
3
|
18
|
57
|
112
|
||
4
|
21
|
60
|
144
|
||
5
|
23
|
64
|
160
|
||
6
|
23
|
69
|
232
|
||
7
|
25
|
74
|
216
|
||
8
|
27
|
78
|
216
|
||
9
|
32
|
79
|
168
|
||
10
|
41
|
74
|
96
|
||
11
|
45
|
67
|
72
|
||
12
|
48
|
56
|
64
|
Analysis
- Which
of the storms described in Part A were category five hurricanes?
- What
information did you use to classify each of the storms?
- Describe
the conditions that led you to issue a hurricane warning.
- Did
the center of the storm pass over the areas to which you decided to issue
warnings?
- When
did the hurricane tracked in Part B reach the status of a category three
hurricane? (Hint: The data presented in Table 3 shows one
measurement for each day of the storm.)
- Did
the hurricane that you tracked in Part B show characteristics of every
category described by the Saffir-Simpson scale?
7.
The formation of a hurricane depends
on what three factors?
8.
Reflect: A hurricane starts out as a
low pressure system, why is this so? Why
would a high pressure area not turn into a hurricane?
______________________________________________________________________
Conclusion
What was your problem?
|
Restate your hypothesis. Was it right? wrong? why or why not?
|
What did you learn in this lab?
|
What did you like about this lab?
|
What were some challenges you had to deal with?
|
What could you do next with this problem? What other tests could you perform?
|
Write down any other additional thoughts, observations, inferences, etc.
|
Subscribe to:
Posts (Atom)