Labels

Wednesday, April 20, 2016

Lab #8 – Tracking Hurricanes

Lab #8 – Tracking Hurricanes

Hurricanes are classified according to the Saffir-Simpson Scale, which categorizes the storms from one to five depending on sustained wind speed, height of storm surge, and extent of damage. Some of the specifics for each hurricane category are listed in Table 1. The National Weather Service issues a hurricane watch when there is a threat of hurricane conditions within 24 to 36 hours. They issue a hurricane warning if hurricane conditions are expected within 24 hours.

Problem

How are hurricanes tracked?

Hypothesis


Materials

Pencil
Atlantic Basin Hurricane Tracking Chart found at http://www.nhc.noaa.gov/AT_Track_chart.pdf

Procedure

Part a—Historical Hurricanes

  1. Familiarize yourself with the classifications of hurricanes according to the Saffir-Simpson Scale in Table 1.
  2. Read about some major hurricanes of the past, which are described in the Data and Observations section, and watch the 2012 Hurricane Sandy Video.
  3. Use the Saffir-Simpson Scale to classify each of the historical hurricanes described in the Data and Observations section. Write the category number in the space provided next to each description.

Part B—Hurricane Tracking
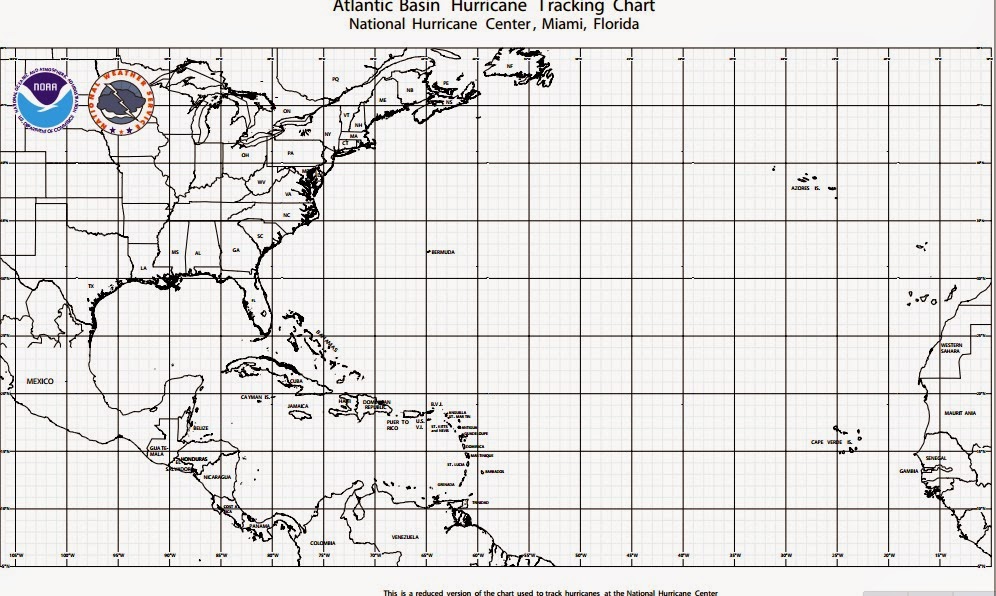
  1. Use the data in Table 2 to plot the course of a hurricane. Start by plotting the storm's location on Day 1 on the Hurricane Tracking Chart in Figure 1.Mark the hurricane's location with a dot, and label it as Day 1.
  2. Considering only wind speed, classify the storm as a tropical storm or a hurricane. If the wind speed is less than 119 km/h, consider it a tropical storm. If the wind speed is 119 km/h or more, use the Saffir-Simpson Scale to decide what category describes the hurricane on this day. Write your observations in Table 2.
  3. Plot the storm's location at Day 2, label the dot, and connect the two dots with a straight line. Classify the storm as described in step 2.
  4. Consider that you are a forecaster with the National Weather Service. You must issue a hurricane warning to any land 24 hours before the center of a hurricane passes over it. Decide if you should issue a warning on Day 2. If yes, what areas would you warn? Write your observations in Table 2.
  5. Repeat steps 3 and 4 for the storm's duration.

Part A

Data and Observations

  1. ____ Hurricane Fran moved into North Carolina's southern coast in September 1996. Total damages from the hurricane exceeded $5 billion. Hurricane Fran had sustained winds of approximately 184 km/h and gusts as high as 200 km/h.

  1. ____ The Halloween Storm of 1991 has been called the "perfect storm." It packed sustained winds of 120 km/h.

  1. ____ Hurricane Bertha pounded the southeast coastline as well as the Bahamas in July 1996. The storm had winds peaking at 184 km/h.

  1. ____ When Hurricane Andrew slammed southern Florida in August 1992, it was the most costly natural disaster in United States history, with about $26 billion in damage. The storm killed 26 people and destroyed more than 25,000 homes. Its wind speeds are now thought to have reached up to 265 km/h.

  1. ____ Hurricane Celia hit Texas in August 1970, causing $1.6 billion in damage. The storm was characterized by very high winds that damaged an airport and destroyed a nearby mobile home park. Its highest estimated wind speed was around 257 km/h.

  1. ____ Hurricane Camille, which hit the Gulf Coast and then swerved east toward the Carolinas in August 1969, was the fifth most costly disaster in United States history with damages of $5.2 billion. Camille caused the death of 250 people. Its sustained wind speeds reached 320 km/h.

  1. ____ Hurricane Katrina, which devastated New Orleans in 2005 was the costliest hurricane, as well as one of the five deadliest, in the history of the United States. Among recorded Atlantic hurricanes, it was the sixth strongest overall.  Katrina made landfall Aug. 29 with top sustained wind of about 201 km/h.


8.       ____ Hurricane Irene, made its final landfall in Brooklyn, New York City in 2011.  Throughout its path, Irene caused widespread destruction and at least 56 deaths. Damage estimates throughout the United States are estimated near $15.6 billion.  Its highest winds reached 120 mph (195 km/h).

9.       ____ Hurricane Sandy affected 24 states in the U.S., including the entire eastern seaboard from Florida to Maine and west across the Appalachian Mountains to Michigan and Wisconsin, with particularly severe damage in New Jersey and New York. Its storm surge hit New York City on October 29, 2012, flooding streets, tunnels and subway lines and cutting power in and around the city. Damage in the United States amounted to $65 billion.  Its highest winds reached 115 mph (185 km/h).

Table 1

Saffir-Simpson Hurricane Scale


Category
Wind Speed (km/h)
Effects
One
119-153
No real damage
Two
154-177
Some roof and window damage
Three
178-209
Some structural damage to small residences; mobile homes destroyed
Four
210-249
Extensive building failures
Five
greater than 249
Complete roof failure on buildings; some complete building failures

 Part B

Day
Latitude (°N)
Longitude (°W)
Wind speed (km/h)
Type of Storm
Issue warning? Where?
  1
15
47
  56


  2
17
53
  80


  3
18
57
112


  4
21
60
144


  5
23
64
160


  6
23
69
232


  7
25
74
216


  8
27
78
216


  9
32
79
168


10
41
74
  96


11
45
67
  72


12
48
56
  64


Analysis

  1. Which of the storms described in Part A were category five hurricanes?


  1. What information did you use to classify each of the storms?


  1. Describe the conditions that led you to issue a hurricane warning.


  1. Did the center of the storm pass over the areas to which you decided to issue warnings?


  1. When did the hurricane tracked in Part B reach the status of a category three hurricane? (Hint: The data presented in Table 3 shows one measurement for each day of the storm.)


  1. Did the hurricane that you tracked in Part B show characteristics of every category described by the Saffir-Simpson scale?


7.       The formation of a hurricane depends on what three factors?

­­
8.       Reflect: A hurricane starts out as a low pressure system, why is this so?  Why would a high pressure area not turn into a hurricane?
­______________________________________________________________________

Conclusion


 What was your problem?
 Restate your hypothesis.  Was it right? wrong?  why or why not?
 What did you learn in this lab?
 What did you like about this lab?
 What were some challenges you had to deal with?
 What could you do next with this problem?  What other tests could you perform?
 Write down any other additional thoughts, observations, inferences, etc.

Monday, February 22, 2016

3rd Quarter Homework

HW:  1. a. Science Article #1 - solid, liquid, gas
             b. Science Article #2 - phase changes


         2.  C4S1: VOCABULARYBQRC, SC #1-4

3.  C4S2: Vocabulary, Blue Question, Reading Check, Self Check #1-4,6


4. C4 Visualizing Main Ideas.
 C4 Review: #1,2,5,6,7,11,13-15,21,22,24,25

5. Molecular Motion Illustrations (balloon activity)

Wednesday, February 10, 2016

Chapter 4 Online Exploration of Matter (HW)

-Watch the video-
1.    Most matter can be found in three states:_____, ______, and ___.
2.  The law of conservation of energy states that matter can never be _______ or _________.
3.  All matter is comprised of _______.  
4.  The universe is made up of _______ and ________.
5.  Give an example of a physical change; what makes it a physical change?
6.  If you were the video's scientific creator, what would you add to show "states of matter"?  How would you explain it?  What models would you use? 

  B. 
   -Play the interactive game-
1.       Describe the arrangement and movement of the particles as you change from a solid to a liquid to a gas.
2.  Describe the arrangement and movement of the particles as you change from a gas to a liquid to a solid.
3.  Pick 2 phase transitions and make a sketch of them.  Describe whether energy is lost or gained in this transition.  


  C. 
       -Play the interactive game-
1.       What happens to the liquid when you heat it?
2.       Does the gas stay in one beaker?  Where does it go?  Why does this happen?  (Think: Energy)
3.       Cool down the gas.  What happens (Use your science vocabulary)?  Why does the liquid appear in both beakers?
4.       Heat the liquid again.  What happens to the gases when you remove the lids?  Why does this happen?
5.      Describe the motion of the atoms in each beaker.
6.  Sort the 9 items into their correct Phase of Matter; make a list in your notebook.
7.       Take the Quiz; write the answers into your notebook.


D. 

      Watch the How Stuff Works Videos States of Matter Changes in State

1.     What happens to the molecules of liquid water when it boils?
     2.  Explain the difference between boiling and evaporation.

    3. What is the boiling point of water in 'F/'C?

    4. What is the melting point of rock?  What is the melting point of water?
    5.  What happens to water molecules when they freeze into a solid?

    6.  At the 2:00 mark, estimate the volume of the liquid in the beaker, don’t forget units!


Thursday, November 19, 2015

Lesson Plan for Considine’s Science classes: 601, 602, 603, 613

Lesson Plan for Considine’s Science classes: 601, 602, 603, 613
The textbooks and workbooks are located in the back of 509.  Please return the books to 509 at the end of the period so the next class will be able to use them.  The students are NOT to write in the notebooks; they are to write ALL of the information in their Science Notebooks. 
A.  Science Workbook
1.   Page 27-29: ALL
2.   Page 30: Complete, Summarize, Connect It
3.   Page 31: Predict, Define
4.   Page 32: Organize, Analyze
5.   Page 33: Model, Connect It

B.   Science Textbook
1.   Page 73: Launch Lab
2.   Page 84: Physical Setting-Define
3.   Page 94: Bionic People

C.   Science Article due Monday!